An open Nasdaq futures desk, with the walls off. The 9 O'Clock before every bell. A 10:30 read on what kind of day it is, and a public grade of that read every evening, hits and misses. The Drop: every finding with its test, and the ones that died. One method, the Day Map, built on the whole tape.
Every trader is told to have a plan. Nobody hands them the day.
Every Nasdaq session has a shape — the open, the hold at eleven, the afternoon, the night. The market's own record will tell you, before it opens, which days today resembles and what those days did. Not a prediction. A map. So I built the desk that reads it. It is now open to other people.
Most people who trade futures lose money. Anyone who hides that sentence is selling you something. It's on my front page, and it's why nothing here is a signal: you get evidence and context, and the decisions stay yours.
How an NQ session actually unfolds: pre-open, the opening range, the 11 o'clock test, the afternoon, then the Globex night. Every one of those anchors tested against the market's own record, on the tape at tick resolution and a year of recorded order book. What held. What died. Where the day usually pays. One idea you can hold in your head for the whole session.
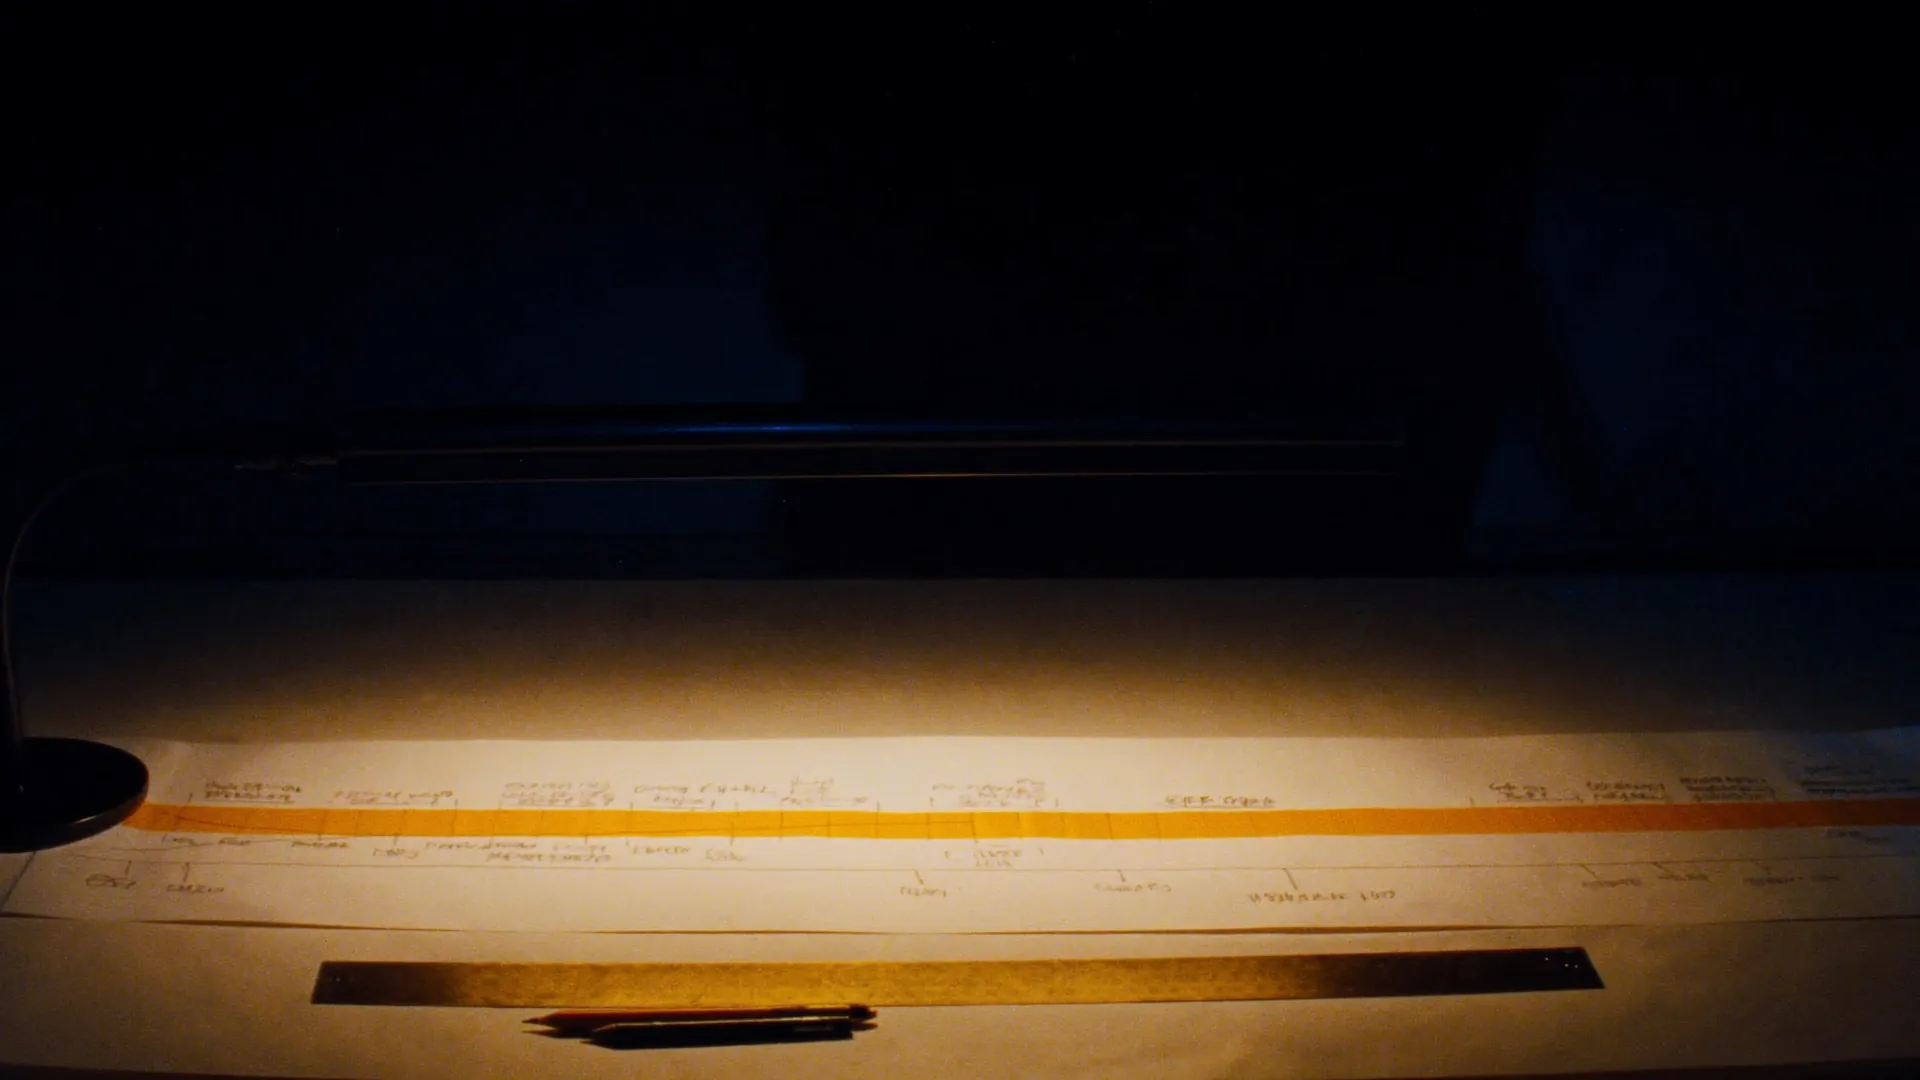
Where the day is measured from. The opening range is the anchor that holds.
KeptHas the morning held above the 9:00 open into 11:00? That answer sets up the afternoon.
Kept21:00 ET is where the overnight session really turns.
KeptThe auction tells you what kind of day this is. The tape tells you what just happened in it. Dealer positioning tells you how hard it is likely to move. None of the three is a signal, and the desk publishes where each one stops being useful.
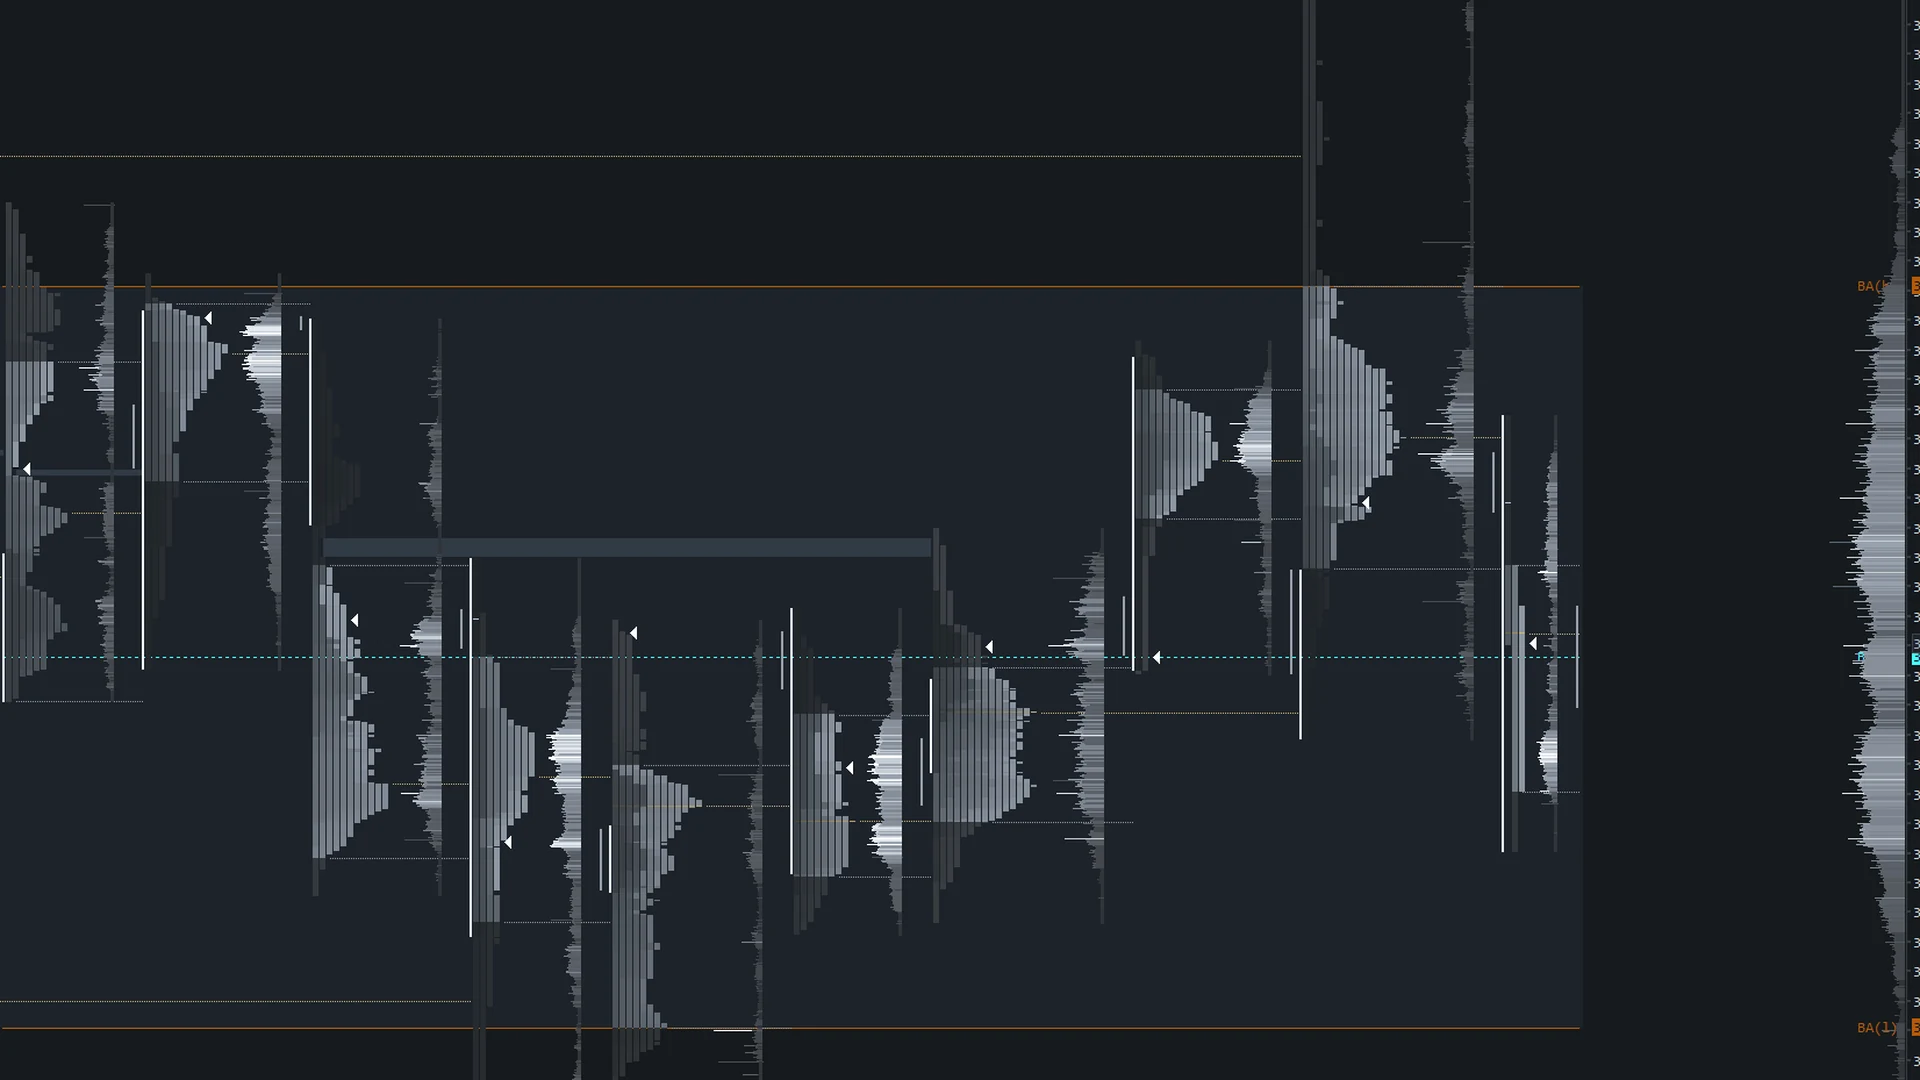
Price advertises for volume. Value is where business actually got done, and a session is the market's attempt to find it again — balance, imbalance, migration, acceptance and rejection.
Measured here: the first hour sets about 60% of the day's entire range. Equilibrium is touched on most days, but a third of days never cross it once — and those are the trend days. "It's extended, so it must be done" has no support: continuation runs flat across the whole ladder, from a third of a percent out to two.
Where it stops. Location tells you where you are, not where you are going. The ruler matters more than the location.
Delta, absorption, and the resting book: what actually traded, at whose initiative, and where size stopped moving price.
Measured here: delta correlates 0.53 to 0.66 with the bar it is in, and with nothing ahead of it. It was tested four independent ways — decile buckets, partial correlation against the bar's own return, run persistence, and conditioned at value-area levels — and came back null every time, sign-flipping out of sample. Absorption reads as a volatility proxy, not a direction.
Where it stops. The tape is present tense. It describes what just happened; it does not forecast. Resting liquidity is the one genuinely orthogonal variable on this desk, and it is still untested — which is why nothing here is sold on it.
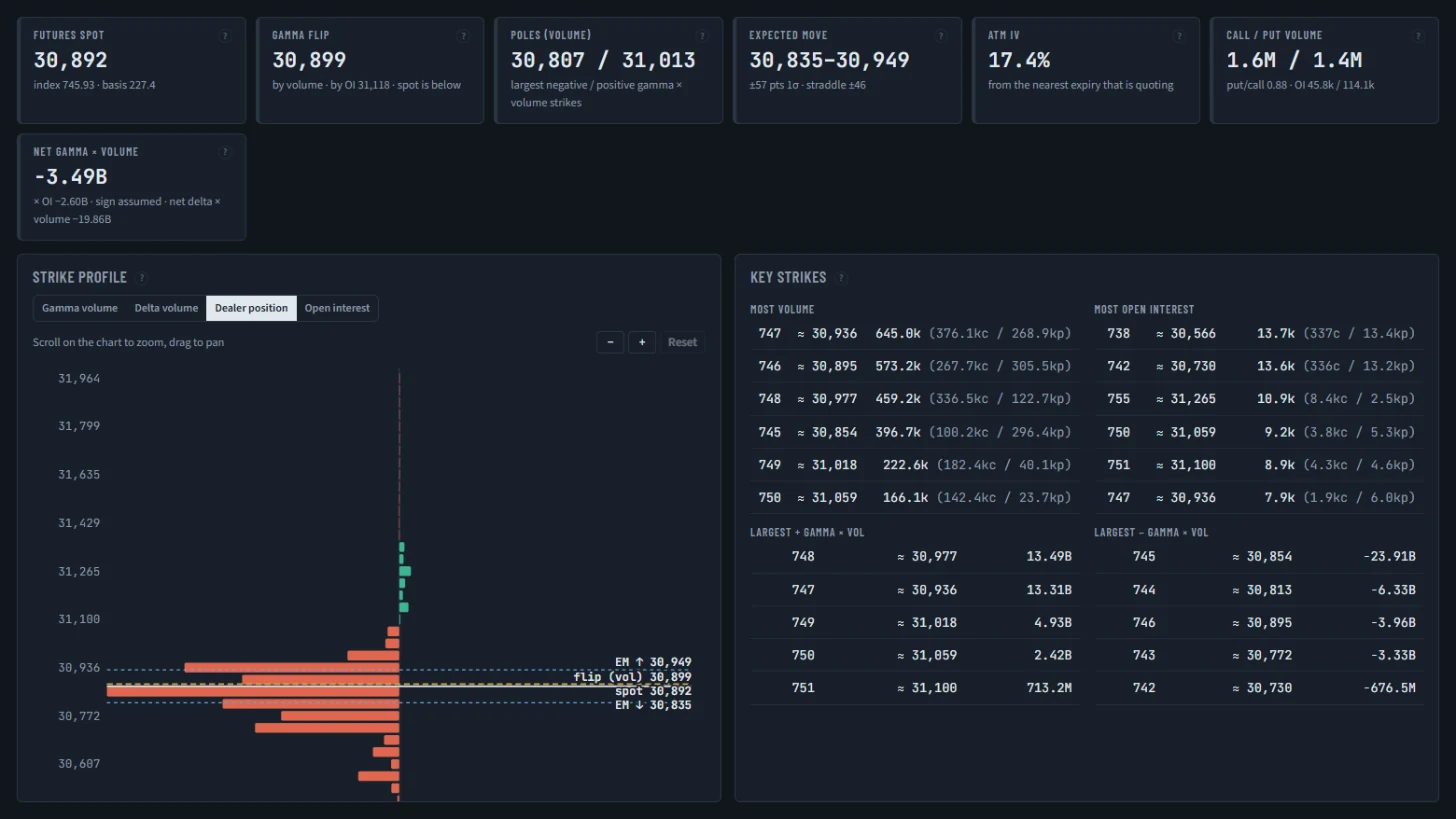
Where options dealers are hedged, computed in-house from the options tape: the flip, the walls above and below, and what they do to realised volatility.
Measured here: long-gamma days run about 0.92× normal range, short-gamma about 1.13×, and that survives the volatility controls. Direction: null. The "70% of days are positive gamma" figure sold in courses failed replication.
Where it stops. Gamma sizes your stop. It never aims your trade. In the most negative-gamma conditions a stop keyed to average range is touched 47.5% of the time against 22.6% in the most positive — same stop, different market. That is a risk input, and it stays graded provisional until an after-costs test exists.
All three answer the same question: what kind of day is this. None of them answers what you should do about it at 10:42 on a Tuesday. That decision stays yours — the desk's job is that you make it with the auction, the tape and the dealer's hedge already in front of you.
Institutional-grade data and one engine that tests every idea the same way. Dealer positioning is measured here, not sold: it gets credit only for what price and volatility can't already explain.
Sample, period, engine, null and split are stated on every drop. Cite it, argue with it, replicate it.
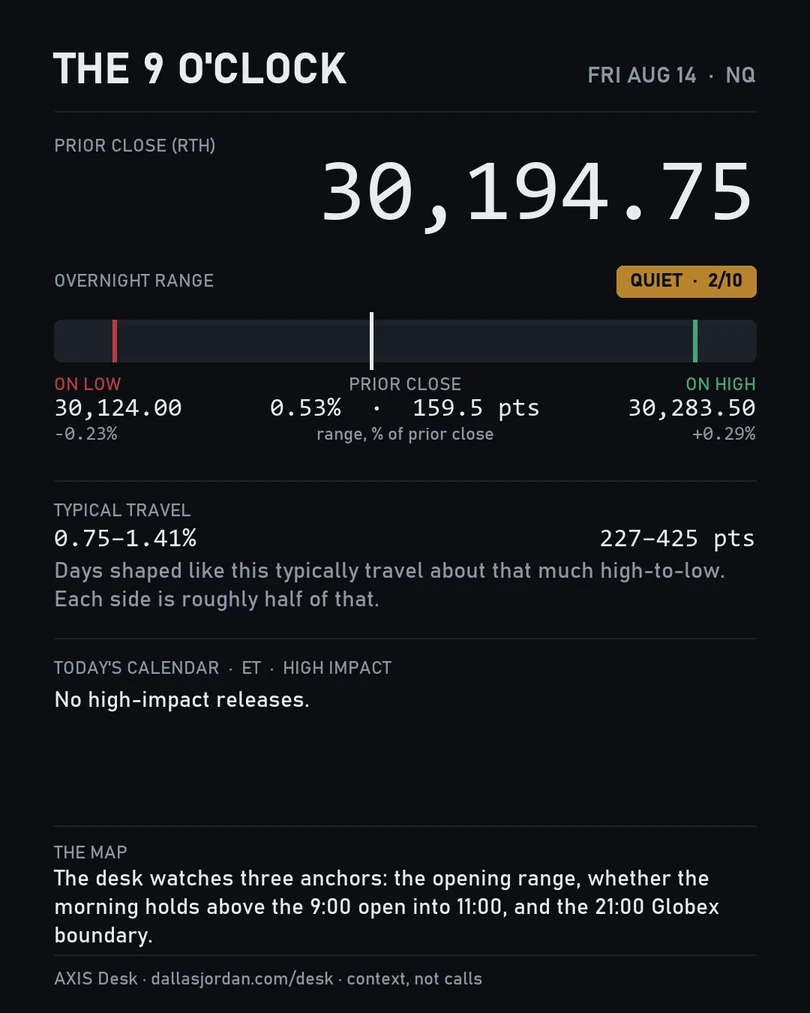
A range model for the session ahead, from the overnight range and recent volatility. 22% better than no view, 8% better than volatility alone, in both halves of the sample. It is where "typical travel" on The 9 O'Clock comes from.
Computed from the options tape with the desk's own gamma engine. First result: long-gamma days run about 0.92× normal range, short-gamma about 1.13× — and it survives the volatility controls. Direction: null. And the "70% of days are positive gamma" claim sold in courses failed replication here — it's a coin flip.
The opening range as the anchor that holds; the 11 o'clock hold; the 21:00 boundary.
The desk's Sierra Chart layout — 24,056 color slots across eleven charts, set by one rule: every buy is green, every sell is red, nothing else is allowed a hue. Built low-arousal on purpose. Included with AXIS Order Flow Studies.
The desk already writes itself a brief at 9:00. This is the public copy: the overnight range in percent and points, read against the record of overnight ranges; the typical travel for days shaped like this; the calendar. No bias. No target. No call. Just the day, mapped, so you walk in knowing what kind of day the data says you're in.
Posts at 9:00 and 9:33 ET, every weekday. Prefer email? Leave your address and you'll get it by email as soon as email delivery opens.
Also posted daily to @JDfutures and the desk's Discord. Free. Unsubscribe any time.
One tested finding a week, with the test attached — sample, period, engine, null, out-of-sample split, expectancy, and where it broke. If a finding died in testing, I publish that too. Dead stats teach. Written to be cited, argued with, and replicated.
Standards are the things you say no to in public. These are the desk's, and they apply to me first.
You'll see every trade I take and why I took it. That's a record of what I did, not an instruction for what you should do. Nobody here is going to tell you what to buy. What happens at the hard right edge is your trade.
A cherry-picked green day is an ad, not evidence. My receipts are datasets and methods.
No rented cars, no rented watches. The product is the work, and you get to watch it happen.
If an offer is only good under pressure, it isn't good.
Studies that fail get published as nulls. Dead stats are half the value of a library.
Nobody honest can make it. I can promise you the standard, the receipts and the room.
No vendor logos as proof and no "institutional" without receipts. The data reach is stated plainly above; the tests are on every drop.
Most people who trade futures lose money. Anyone who hides that sentence is selling you something. I put it on the front page.
Nine years in the markets — crypto, then forex, then futures — the last of them on one instrument, studied properly. The desk went systematic in 2024: the whole tape at tick resolution, an order book recorded session by session, and a rule that every idea gets tested before it touches money and the failures get published too. AXIS Desk opens that desk to other people. He is in the room every day the market's open, and the same standard applies to him.
Two ways in, on one page: the Full Desk, the software, the dashboard and the room; or AXIS OTP, a 6-week bootcamp, twelve seats per cohort with both builders.
 DESK
DESK